


“1999” and “Bubble” are buzzwords I keep hearing in investment circles these days. And with AI being rolled out the way the internet was being rolled out, it kind of makes sense to make the comparison. But as Livermore once said, opinions are full of shit (paraphrasing).
So what are the facts? How does the market actually line up to where we are?
I went and marked the Nasdaq in 1999 against the Nasdaq in 2026.
They don’t look exactly the same. They rhyme. Even the time under consolidation is the same. A four-month period. A three-month period. Same order. Same place in the sequence.
1999
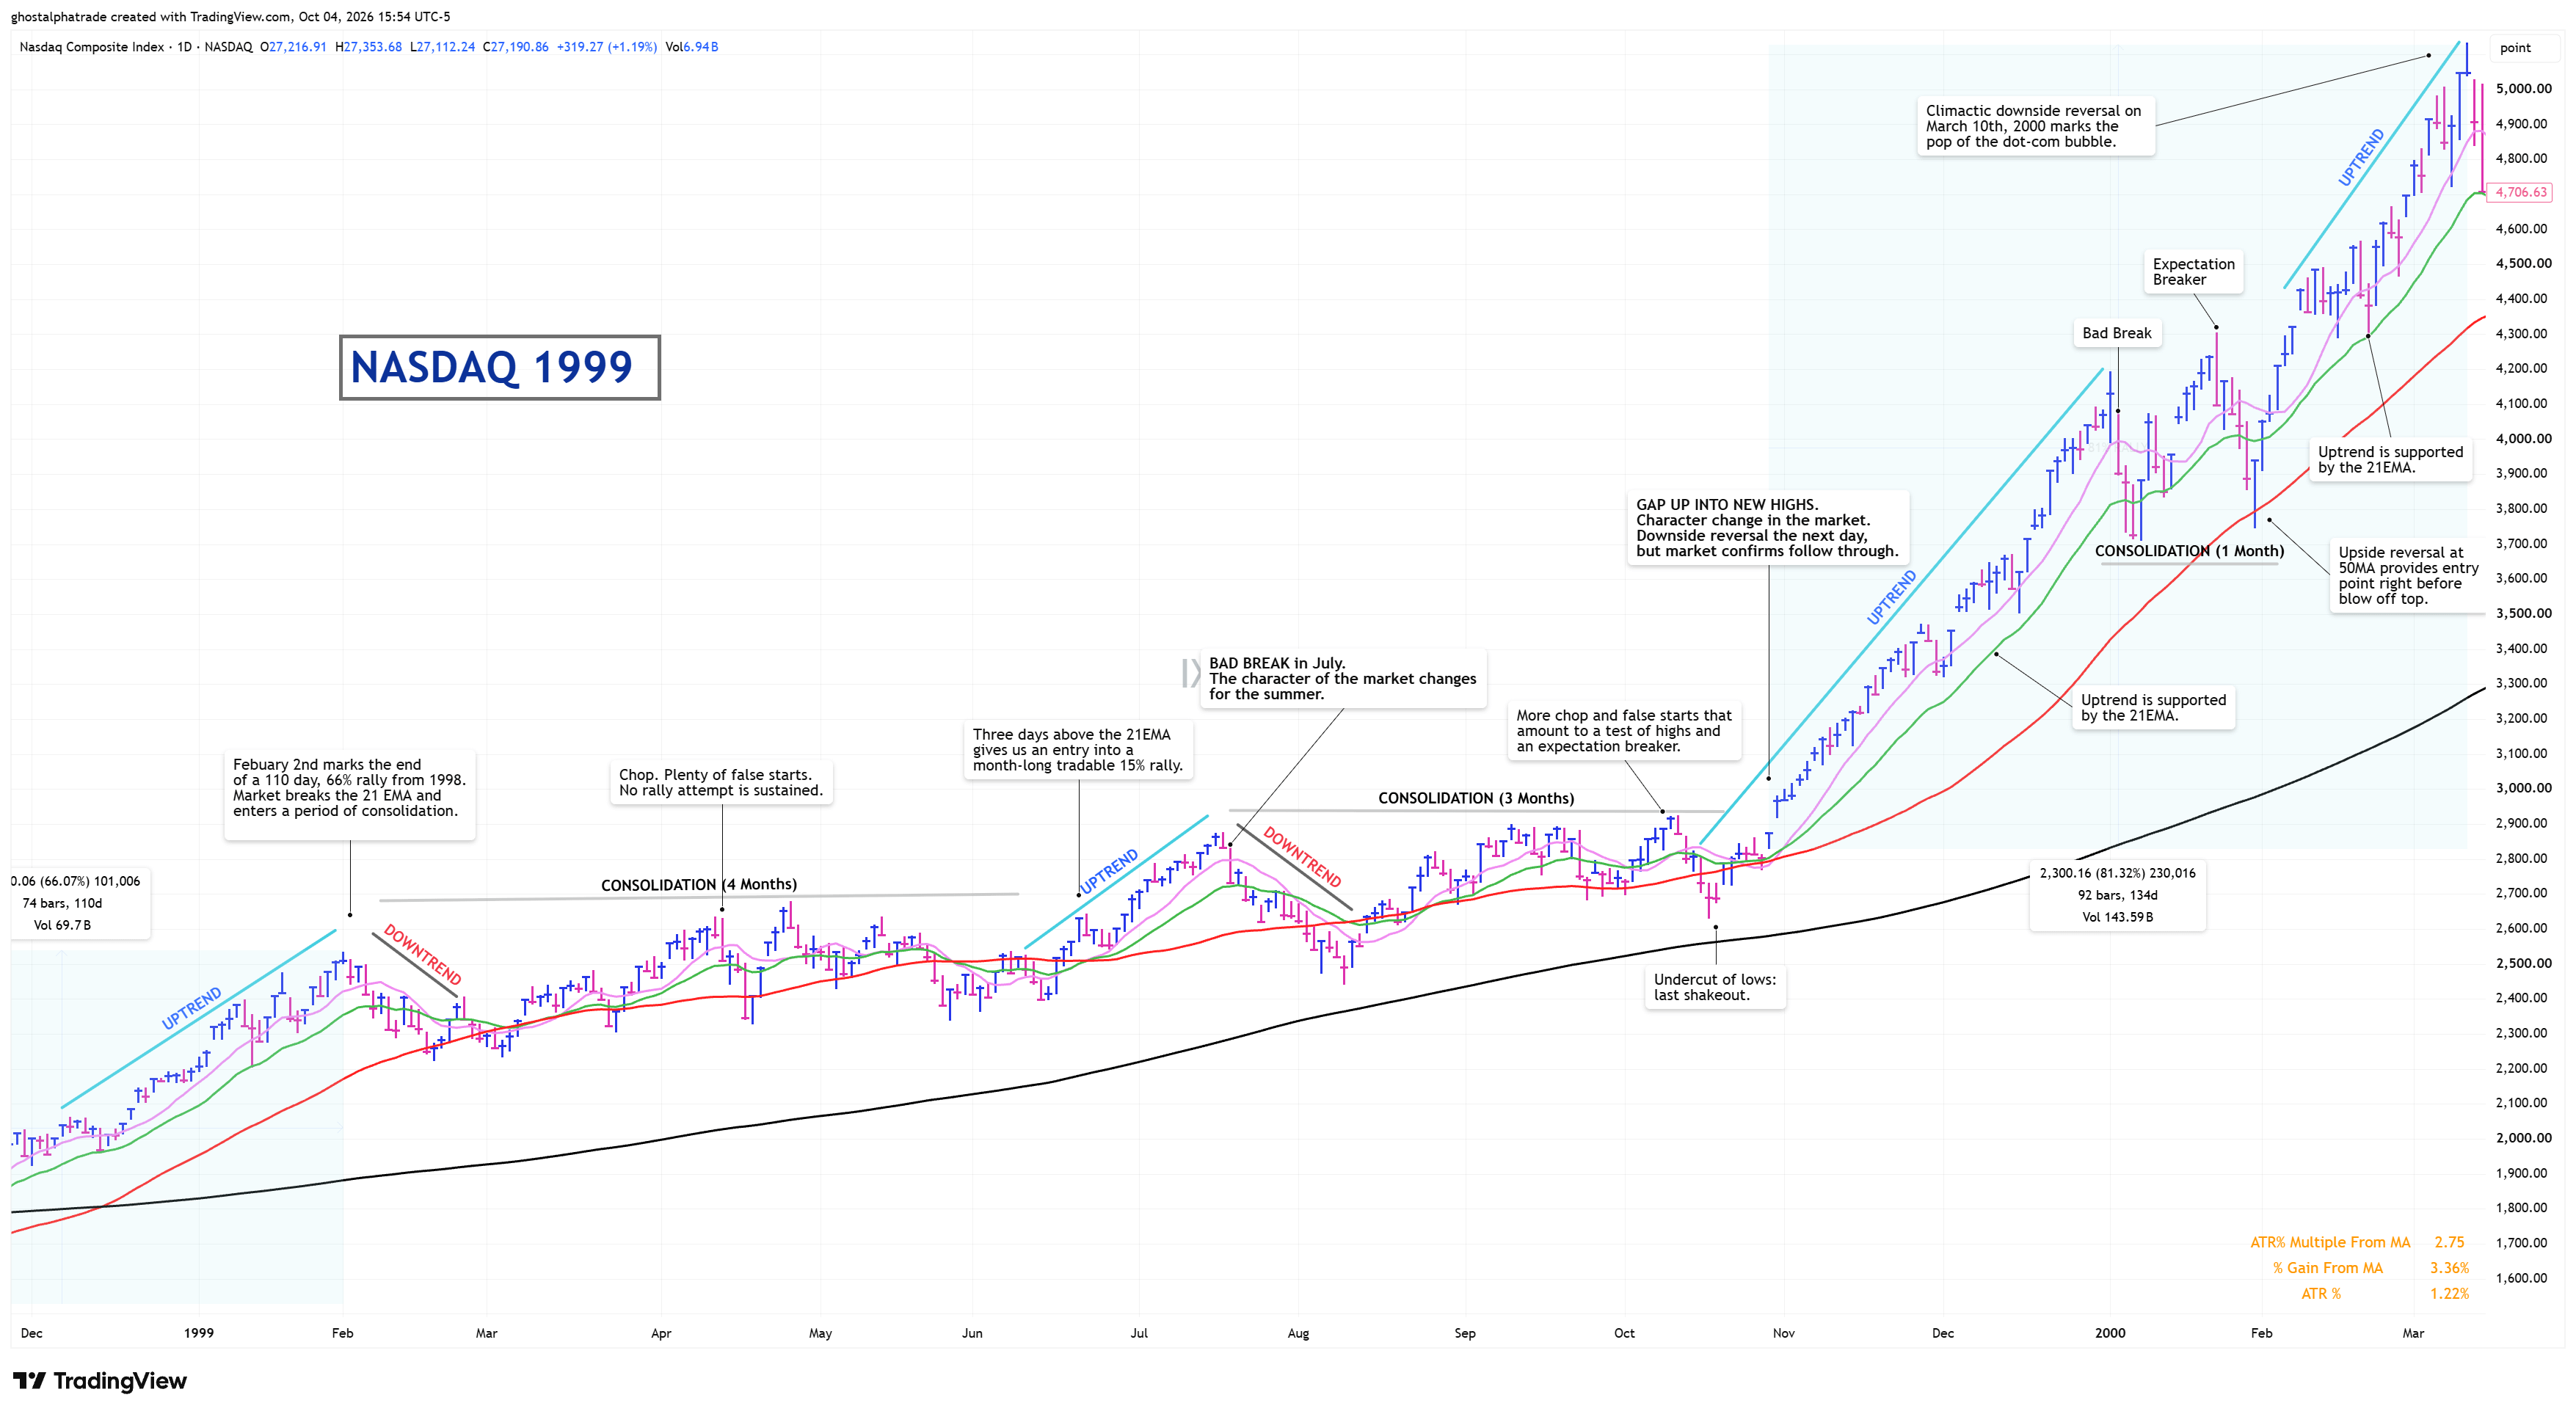
February 2nd marks the end of a 110 day, 66% rally from 1998. The market breaks the 21-day EMA and enters a consolidation. Four months of chop and plenty of false starts. No rally attempt is able to be sustained during this time.
Three days above the 21-day EMA then gives us an entry into a month-long tradable 15% rally. Then a bad break in July. The character of the market changes for the summer. Three months of consolidation. More chop and false starts that amount to a test of highs and an expectation breaker.
Then the gap up into new highs. This turns out to be a character change for the market. Downside reversal the next day, but the market confirms follow through buy trading through that high.
After that spot, we have a life changing uptrend to lead into the bursting of the dot-com bubble. But if you let the 21-day be your guide, you made incredible progress. 81% rally.
2026
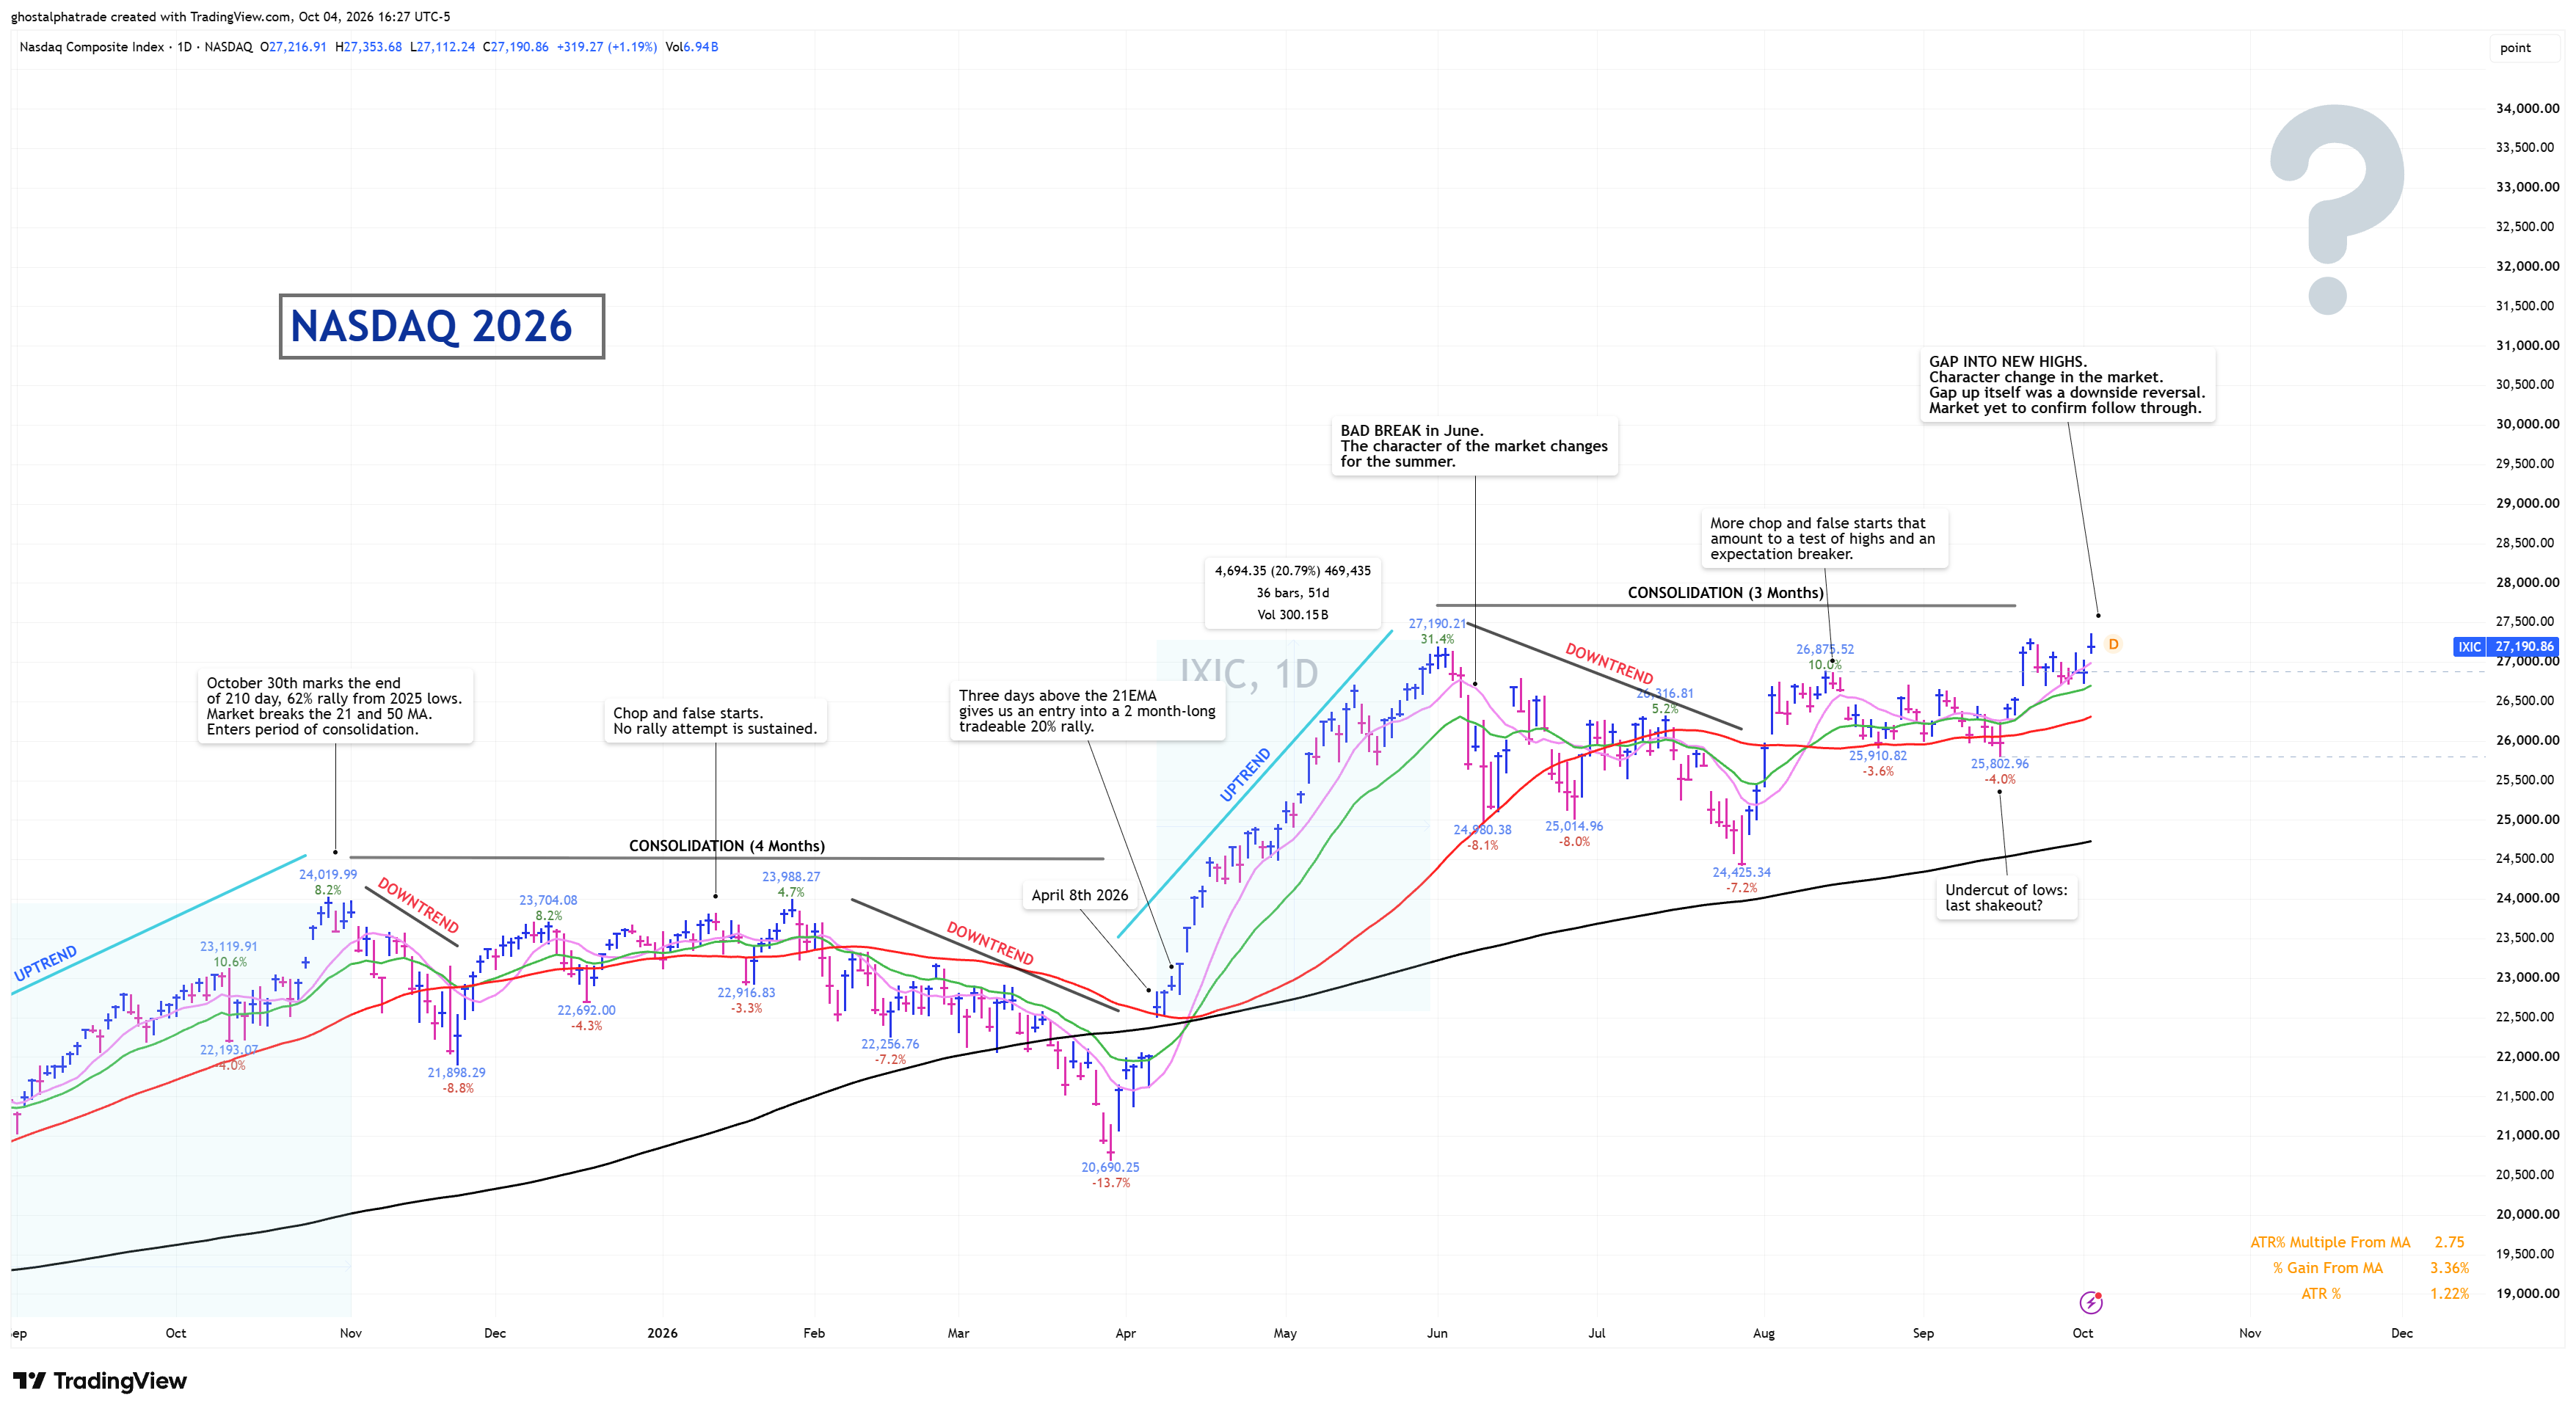
October 30th marks the end of a 210 day, 62% rally from the 2025 lows. The market breaks the 21-day and the 50-day and enters a consolidation. Four months of chop and false starts. Yet again, no rally attempt is sustained.
Three days above the 21-day gives an entry into a two-month tradeable 20% rally. April 8th marks the run we had with many AI-names leading the charge. This was our “lockout-rally” of 2026. Then a bad break in June. The character of the market changes for the summer. Three months of consolidation. More chop and false starts. A test of highs. An expectation breaker.
Then the gap into new highs on Friday, October 2nd. Character change in leaders. The gap itself was a downside reversal. A key differentiator from 1999: The market has not yet confirmed follow through.
Where does this leave us?
To be more confident in this precedent, we need to take out the recent highs from Friday. We need to trade another new high. This week becomes very important.
Make no mistake, there are differences in these charts. The first uptrend of the year is where I see the biggest divergence. Our April run versus the June run in 1999. The June run did not have a gap up. Ours did. And ours also started from a deeper correction.
The other difference is the fundamentals of the leaders. In 1999 a lot of the companies that had great runs did not have any earnings or sales growth. They were simply associated with the internet and went up because of that in itself. The leaders in 2026 have incredible earnings and revenue growth behind them. They are actually good growing companies. That is a plus one for 2026 over 1999, to be frank.
If they are going to rhyme, the uptrends are sustained by the 21-day exponential. That is where I hang my hat on support. When do I get out. I stay involved until a close or a break of the 21-day exponential. That is what this chart and study taught me.
I don’t call market tops and bottoms
This is not financial advice. I am not an investment advisor. I am just a dude that trades stocks and loves jiu-jitsu.
This could absolutely not work. I just wanted to show what the charts are telling us. I did the homework just in case, so if it does run I have a precedent to work off of, and places I can confirm.
If it doesn’t work out this way, that is fine! You cut losses and live to fight another day. You don’t dig your feet in the sand, especially if the precedent is broken. Maybe there is a better fitting precedent out there that I don’t know about. As of right now, this is what I have to work with.
All I know is I can’t put my faith in people talking about the rates, war, oil, breadth and the wall of worry. I strictly trade leadership in the market. The leaders are looking right. The market is looking right. I have to go with that over opinions and market anxiety.
There are enough positive things for me to be optimistic, and I am participating. The market itself is a catalyst away. If it can do this with the pressure on it now, imagine what it can do with some of the pressures coming off?
I think it is a beach ball underwater. We’ll see.