


Model Book: SanDisk (First half of 2026)
This is a study of a model book move in the first seven months of 2026.
From the left side of that run at $244 to the high at $2,354.39, the stock ran +865%. I bought the April 8 follow-through day and sold June 17 around $1,970.
I study model-book stocks so the next one is less of a stranger. Where it found support. Where it set up again. Where the character changed. When you are in one, every drop feels like the end. After you review a completed winner, the 10-day and the 21-day start to mean a lot more.
Why this name
SanDisk is NAND flash. Memory cards and SSDs, then the AI storage binge. You do not need a 10-K to feel it. Walk into a Best Buy. Hard drives and memory are expensive because the supply is spoken for. Datacenter and on-device AI are eating the bits. That is why the earnings and sales went vertical once the shortage bit.
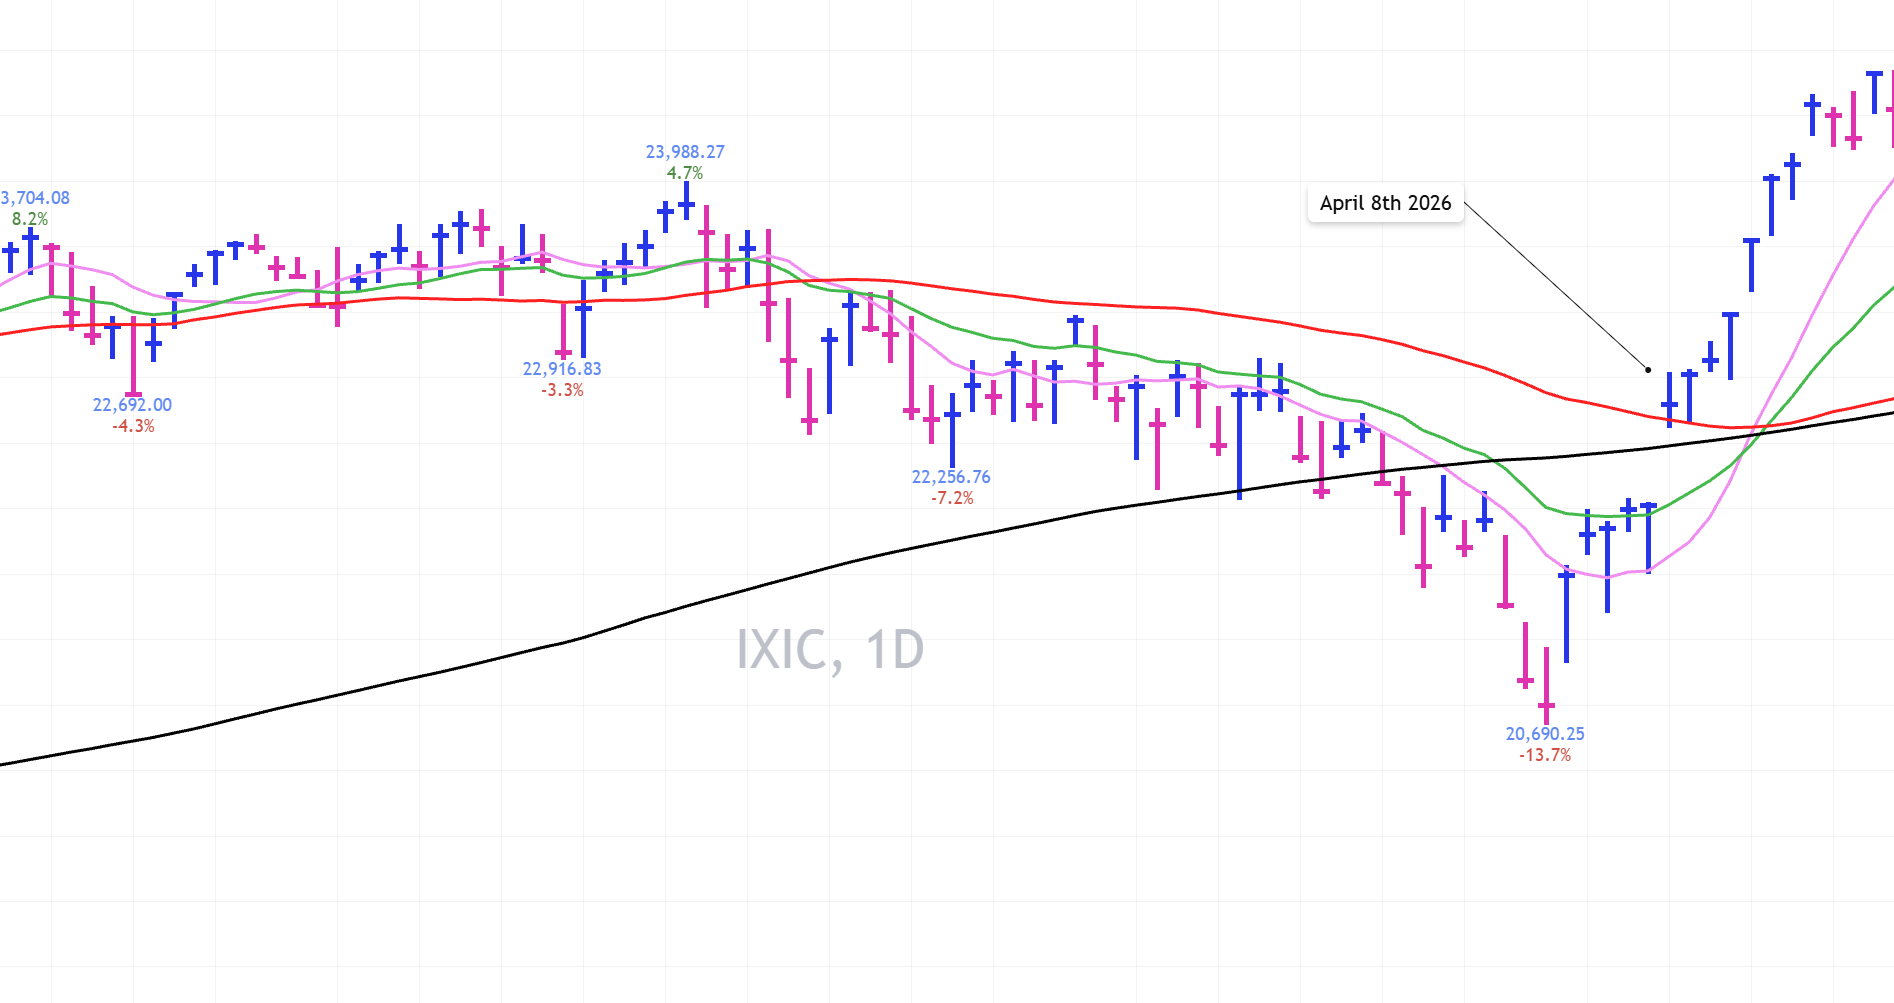
The other half of the study is the market. I am putting the Nasdaq chart from April 8 next to the SanDisk chart for reference. A leading stock breaking out while the market is turning from a correction into an uptrend is where most of the money gets made. Those stretches are rare. That is the point of marking them.
The setup
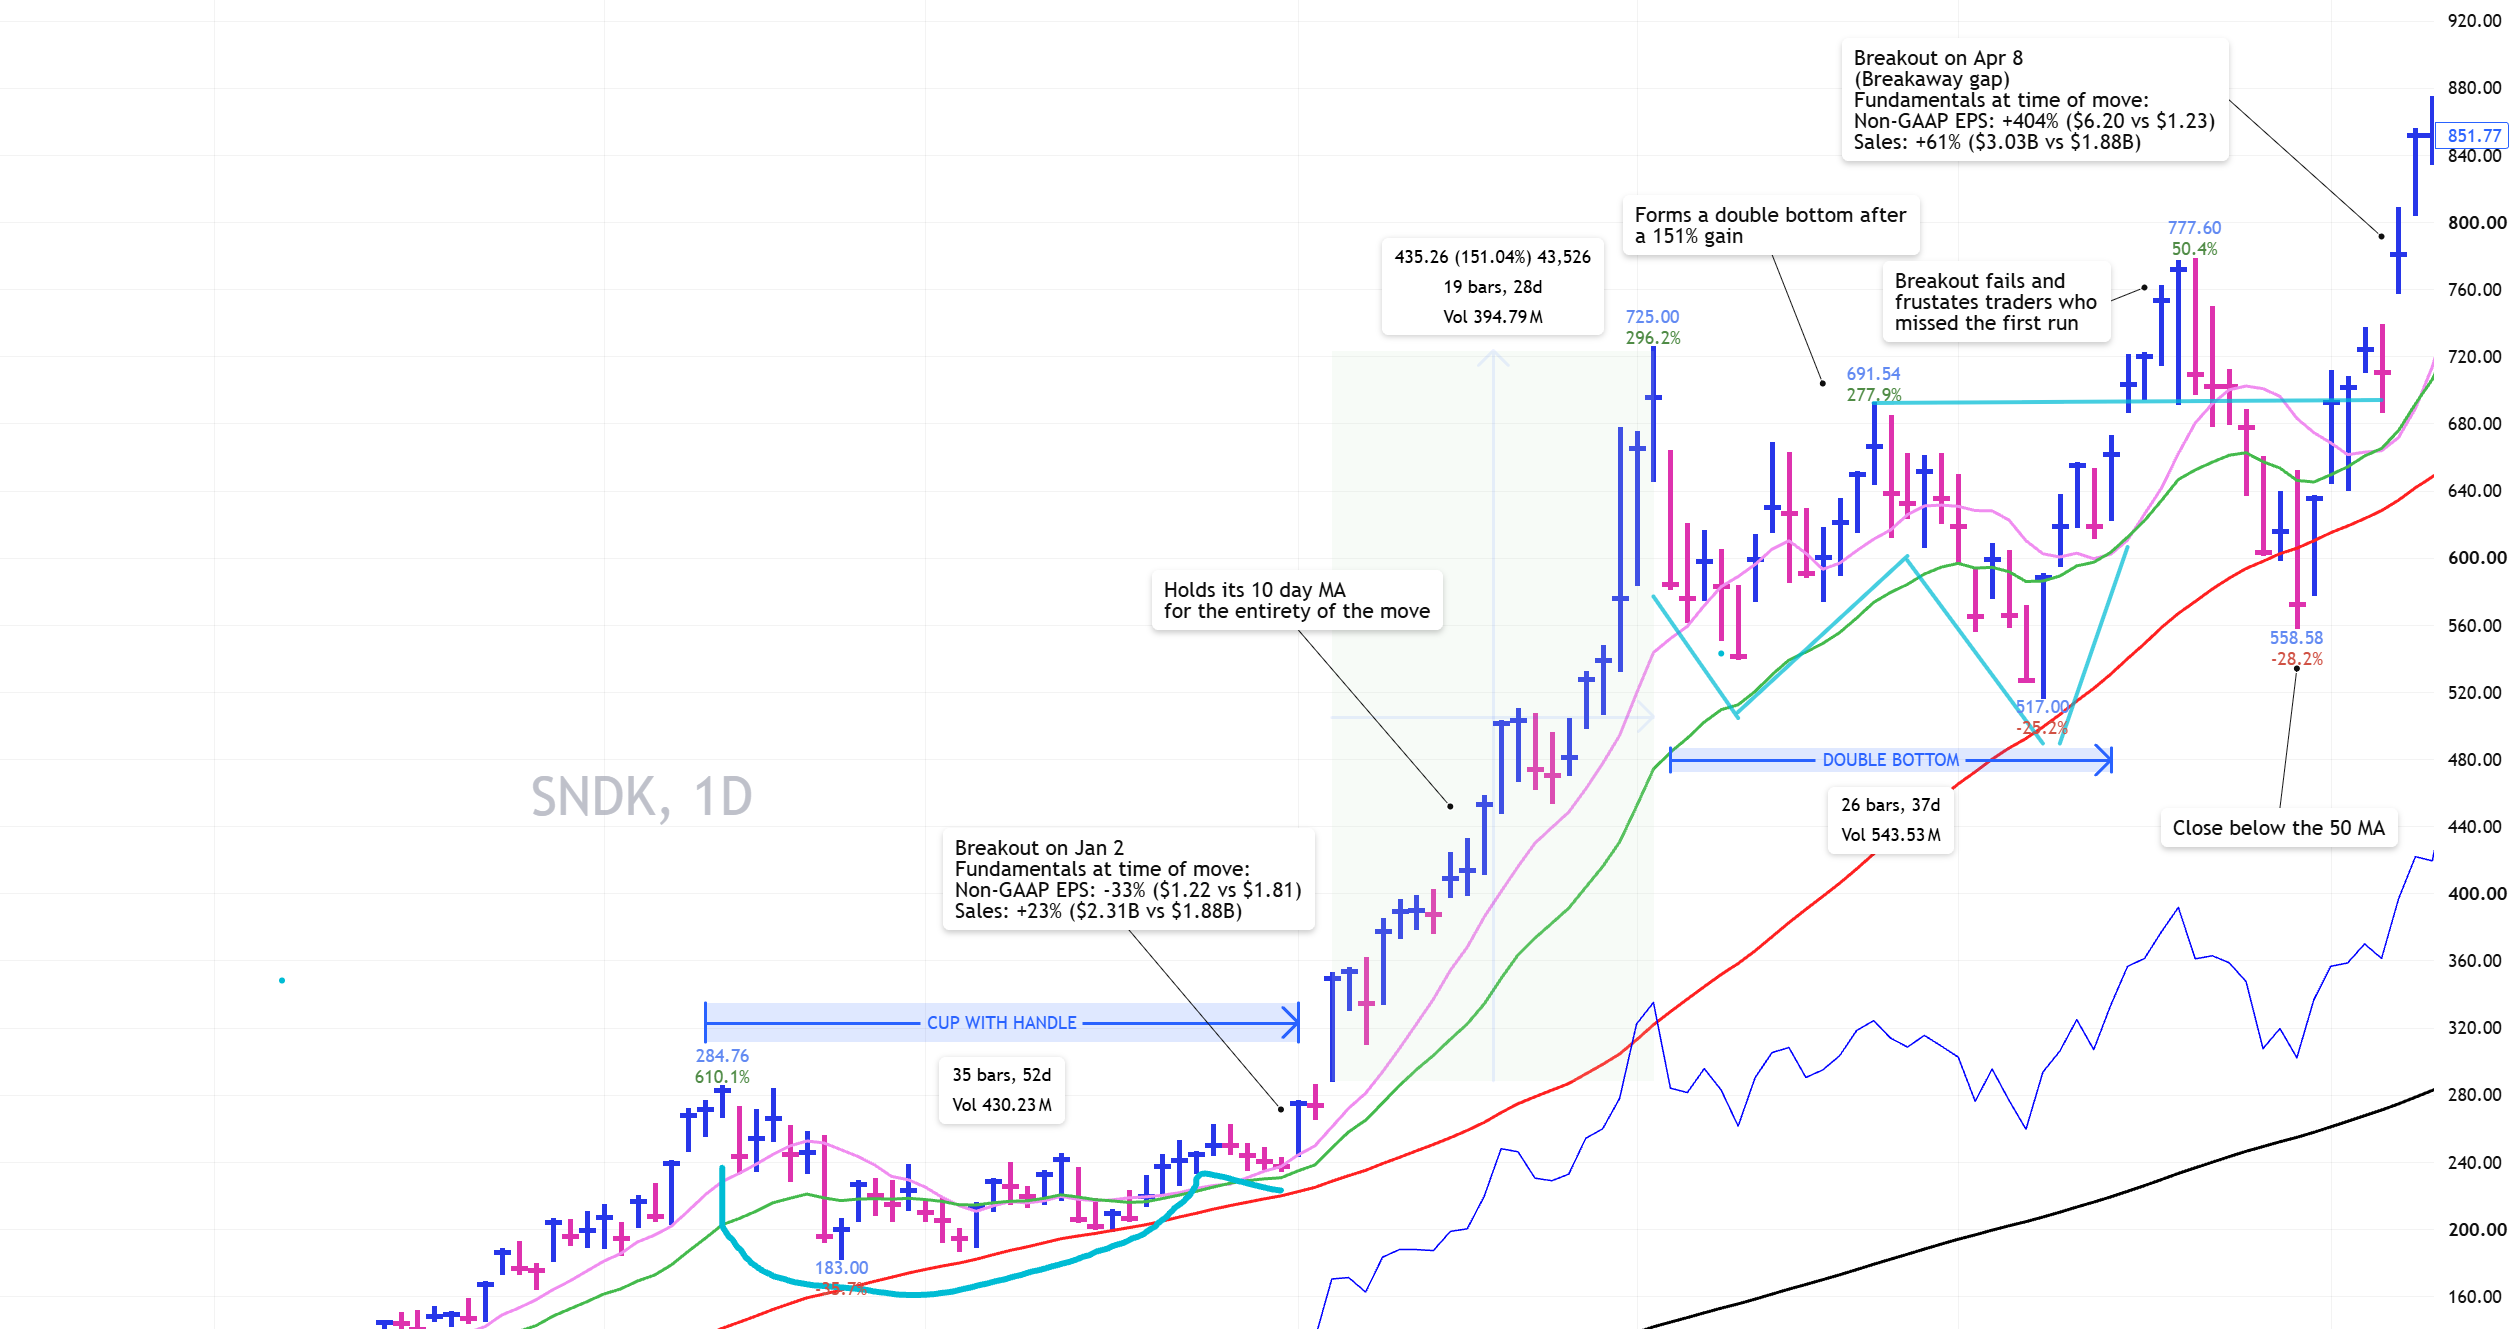
Late 2025 was already a run. Then the stock went sideways and built a cup-with-handle over 52 days.
It broke out of that base on January 2, 2026.
Live fundamentals that morning:
Non-GAAP EPS: -33% ($1.22 vs $1.81)
Sales: +23% ($2.31B vs $1.88B)
Sales were accelerating. Earnings were not. From that breakout it never undercut the breakout day or the 10-day. It held the 10-day for the entire first leg, up to an intermediate top around $725. That was +151% in 28 days, 19 trading sessions.
Another chance to buy
Then it built the base this study is really about. A double bottom starting February 4. 37 days. 26 sessions. After a 151% run, that is a normal pause.
It broke out of the double bottom on March 16 on a 6% gap. Looked buyable if the market had been in a better position. I would have been buying it there. It ran to $777, then failed. Undercut the gap day, fell to $558.58, and closed below the 50-day.
That is a sell for me every time. At that point the chart looks like a failure. It lined up with the worst of the Iran news. The market was under real pressure. It felt like the world was ending.
Six days later the stock recovered and broke out again. April 8. Market follow-through day (which is the key here).
Breakaway gap out of that same consolidation, +9.86%. Close: $780.90. That is the day I bought it. Here is what the Nasdaq looked like:
Live SNDK fundamentals on April 8:
Non-GAAP EPS: +404% ($6.20 vs $1.23)
Sales: +61% ($3.03B vs $1.88B)
Now the earnings had caught up to the sales. Now we have motion.
The move
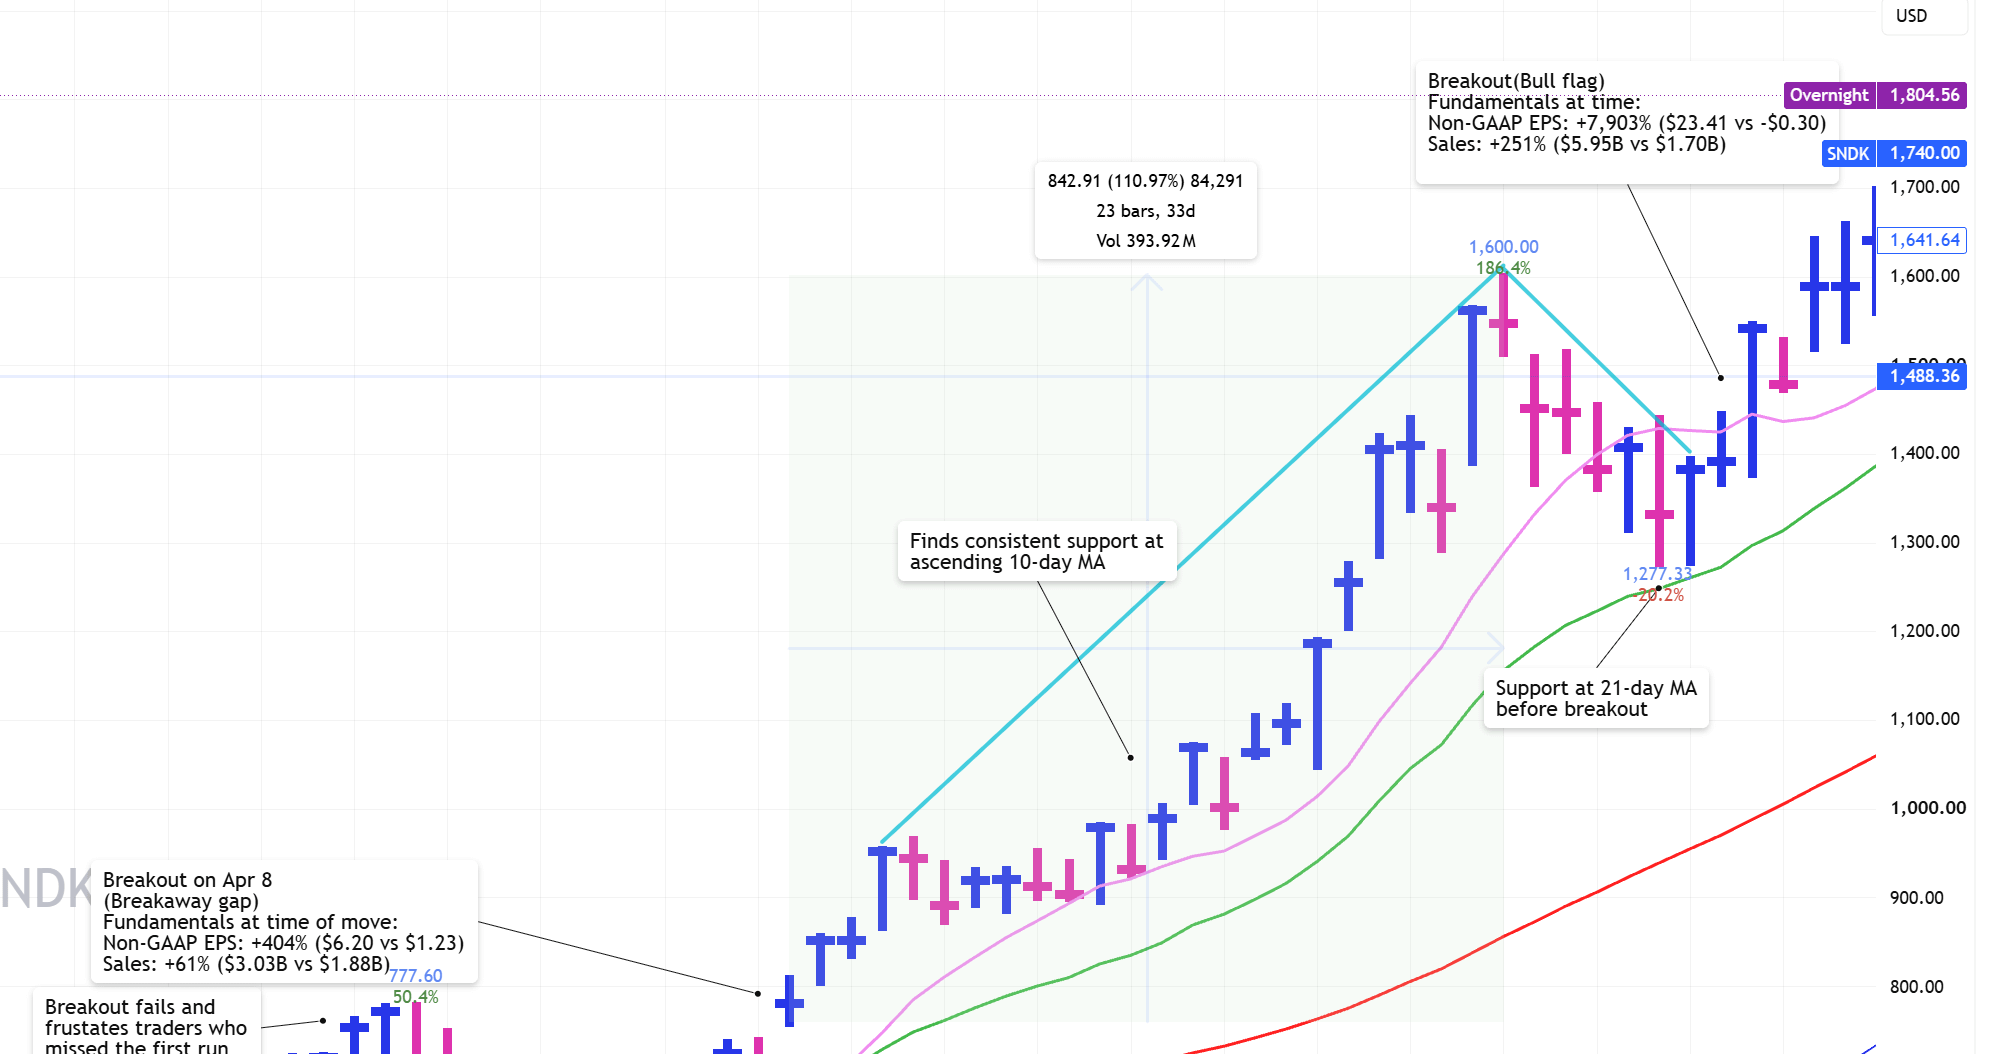
From the April 8 gap, the stock stayed in an uptrend and used an ascending 10-day as support. It did not close below it. When it tagged the line, it bounced.
April 8 to the next intermediate top at $1,600 was +105% in 33 days.
Then a pullback. It closed below the 10-day and formed a bull flag. Short base. The 21-day held the whole time. It never traded below that average.
Breakout of that flag: May 21.
Live fundamentals on May 21:
Non-GAAP EPS: +7,903% ($23.41 vs -$0.30)
Sales: +251% ($5.95B vs $1.70B)
Year-ago EPS was a loss, so the percent is the ugly number a screen will print. The sales number is the clean one. Either way, the fundamental case had gone from fine to violent.
That May 21 breakout is where I added. The 21-day still untouched.
The top
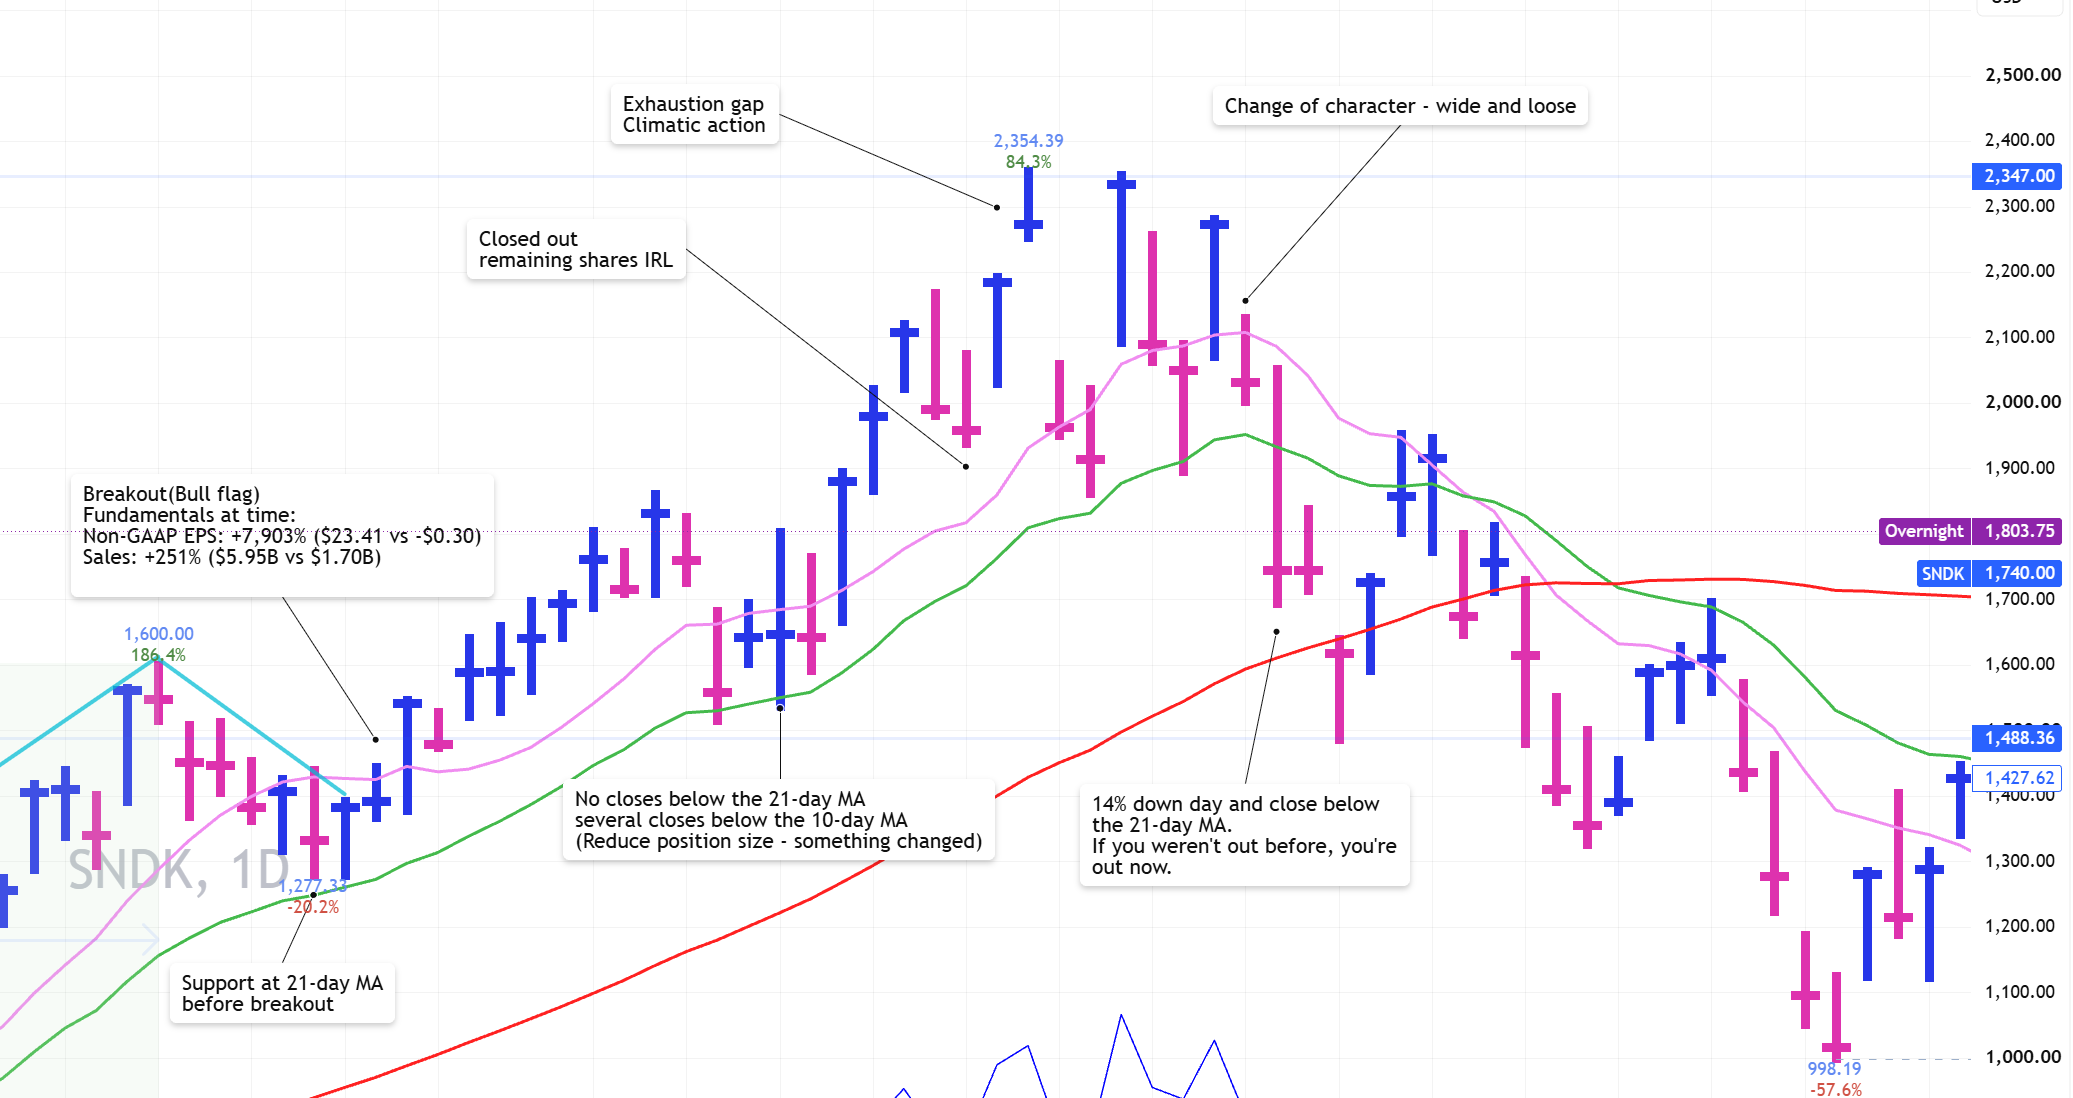
From May 21 it ran to $2,354.39.
On the way it closed under the 10-day for four straight days. Abnormal. That started after June 5. June 5 was a character change in the whole market. The AI trade got hit. Sandisk and a lot of the names around it started acting different.
Still no close below the 21-day. Several closes below the 10-day. That is the signal to cut size. Something had changed.
Then a climactic push into the high.
I closed my trade on June 17. Abnormal price action and undercuts of prior days. Sold around $1,970.
Two days later it tagged $2,354.39 on an exhaustion gap. I thought I made a terrible mistake. But then it got wide and loose.
Down 13%, Up 22%, Down 10%, Up 11%.
Then the 21-day finally broke. Close down 14% that day. If the June 5 character change did not get you out, that day does.
From there it gapped down through the 50-day and kept going. Low of the decline: $998.19.
It has set up again since. That is a different study.
What this is for
I remember being in this stock. Every dip felt like the end of the trade. Then you step back and look at the averages. It did not close below the 21-day until it was done. That is the exercise. You study the winners so the next one feels more comfortable.
I hope you enjoyed this walkthrough, as I plan to continue these type of studies in the future. I also urge you to go back and look at it yourself. If you find something that I missed, please let me know!
If SanDisk makes another model book run, I will be sure to cover it again in the series.