

Situational Awareness: How to Know What the Market Is Actually Doing
When I first started studying charts seriously, I made the same mistake almost every new trader makes.

I spent the majority of my time looking for the perfect stock. The right earnings, the right chart pattern, the right story. Hours on weekends going through setups. I’d find one I loved, buy it, then watch it go nowhere. And I’d come away thinking I’d missed something about the company.
I hadn’t missed anything about the company.
I’d missed the ocean.
There’s a concept that changes how you think about markets once you hear it.
Nine out of ten stocks are going to follow the general market. That’s not an opinion, it’s a historical fact that William O’Neil spent decades documenting. The best stock in the world is still mostly a hostage to the environment it trades in.
Think about it this way: Everyone is obsessed with which boat they want; which stock to buy, which chart looks cleanest, which setup is highest conviction. But it doesn’t matter what boat you’re in if the ocean is in the middle of a storm. You’re not getting from point A to point B regardless of how fast your boat is.
The market is the ocean. You have to watch it.
Markets cycle through three broad conditions. Uptrend. Downtrend. Sideways range. Your job as a growth investor is to know which one you’re in at all times, because each one calls for a different level of involvement. Aggressive, defensive, or patient.
The simplest tool I’ve found for this (and I’ve seen versions of this idea attributed to a few different market legends going back to the Market Wizards era) is the 200-day moving average. If the market is living above the 200-day and finding support there, the long-term trend is up. If it’s been struggling below the 200-day for an extended stretch, you’re in a bear market. That’s the broad lens.
But I think about it with a little more nuance than just bull or bear.
I break the market into three time frames, and each one has a moving average.
The 21-day moving average represents the short-term trend. The 50-day represents the intermediate trend. The 200-day represents the long-term trend.
When the NASDAQ starts to reclaim the 21-day and trade comfortably above it after a correction (meaning the low of daily trading bars is sitting above it, not just poking through), that’s my signal to start pilot buying again. Testing the waters. Not full throttle, but back in the game.
The 50-day tells me the intermediate trend has recovered. At that point, I’m more active.
The 200-day closing back over tells me the long-term trend has reset. That’s a green light for the patient capital.
Now here’s where it gets specific for growth investors.
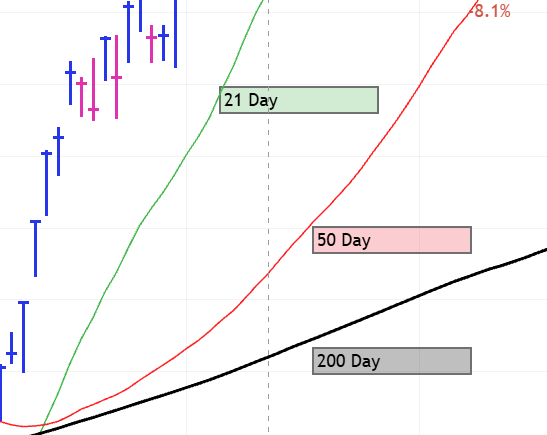
When you’re trading high-momentum names and buying strength, you don’t just want the market above these levels. You want the moving averages in order.
MA’s “in order” means: the 21-day is above the 50-day, and the 50-day is above the 200-day. All three sloping higher.
That configuration tells you money is flowing into risk assets consistently across all three time frames at once. Short-term, intermediate, and long-term all trending the same direction. That’s what I call growth mode. That’s when I’m initiating new positions and pressing my best setups:
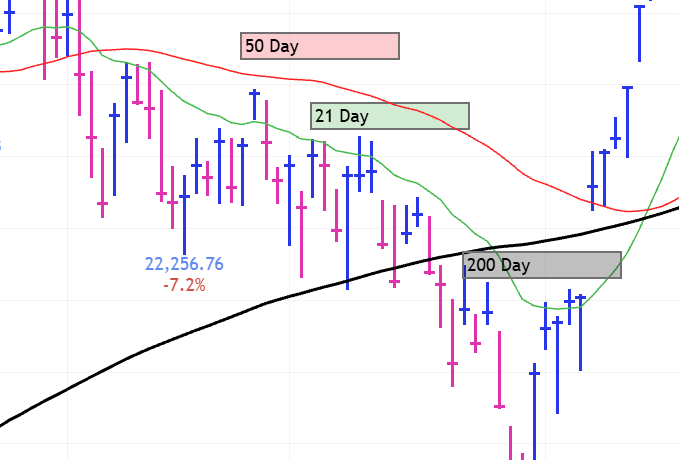
When that picture breaks down and the 21-day starts to cross below the 50-day, or the 50-day turns sideways and starts threatening the 200-day, that’s a warning shot.
There’s a secondary signal worth knowing about.
When growth starts to fade, institutional money doesn’t just sit in cash. Fund managers are running client money and they have to stay invested. So they rotate. Money comes out of high-octane growth names and into defensive sectors. Consumer staples. REITs. Utilities. Procter and Gamble starts perking up when growth is rolling over.
If you’re scanning for setups and you notice a lot of regional banks and consumer staples names looking clean while your growth watchlist is a mess, that’s the rotation telling you something. The market’s risk appetite has changed, even if the index hasn’t fully broken down yet.
Pay attention to what’s setting up. It tells you where the money is going.
Here’s what I love most about this.
Individual investors have an advantage that almost no one talks about. We can go to cash.
Portfolio managers at Fidelity and BlackRock cannot do that. They’re managing customer money with mandates. When things get choppy, they rotate defensively. They can’t hide. We can.
Going to cash isn’t giving up, it’s discipline. It’s our biggest edge. the market will always give you another chance to deploy capital when conditions improve.
(Keep in mind that this doesn’t apply to indexing or other long term investment strategies.)
Right now the market is in a range. It’s a time to be watching, building your list, and identifying which stocks are refusing to break down while everything else does. This is also a good time for upside reversal set-ups.
And if you’ve done the work, you’ll be ready.
Ghost Alpha documents one trader’s real-time journey through the market. If this was useful, subscribe for weekly analysis, setups, and the occasional hard lesson learned.
One thing I've learned is that cash is a position too. Sometimes the best decision is to wait instead of feeling like I have to make a trade.
I like how you broke this down. The boat and ocean analogy made a lot of sense to me. Thanks for sharing it!
Great trend indicators and a great reminder of how funds rotate their clients money.
I think the end of June, being another close of the 2nd quarter, has led to the most recent volatility. Fund managers are selling to lock down profits. When they build their Annual Prospectus to give to potential clients in 2027 and share with existing clients, I would suspect they want the quarters to reflect positive returns. They know all the Fund Mangers in the US and abroad are selling this time of year.