

What Sales Taught Me That Wall Street Never Did
Why revenue growth is the only number that matters before you look at a chart


There’s an aha moment in every sales career where you realize you know something your boss doesn’t.
Not because you’re smarter (although I have had some terrible managers in my career), but because you’re the one sitting across from the customer every single day. Your buyer will tell you things they’ll never put in a survey or say on an earnings call.
I remember a quarterly business review early in my tech career. Our VP was running down the list, asking each rep what they were seeing.
“What are the customers saying?”
That’s the question that I always think about.
We knew it weeks before he asked. We knew it before any analyst updated their model. We knew it because the deals told us. The urgency in a customer’s voice told us. The ones who suddenly stopped returning calls told us. The ones who wanted to get something signed before the quarter ended told us.
“We keep losing to Microsoft. They have all of the relationships because of the stickiness of O365.”
That information didn’t come from a dashboard or a spreadsheet. That knowledge came from real conversations with our customers.
The people closest to the customer know the truth about a business before anyone else does. Leadership catches up eventually. The market catches up last.
I didn’t connect this to investing until years later. But when I did, it changed how I looked at every stock I’ve ever bought since.
In enterprise software sales, almost every deal you work is a competitive deal. The customer doesn’t just come to you. They bring in three or four vendors, run a formal evaluation, score everyone, and pick a winner. And when that contract gets signed, it means something.
It means your product beat the competition on a level playing field. It means the customer trusted your company over every other option they had. It means the market voted.
Now think about what it means when a company is winning those votes quarter after quarter. When revenue doesn’t just grow but accelerates, when the growth rate itself is getting bigger every three months, when customers keep choosing them over and over in competitive situations against real alternatives. That’s a signal that goes way beyond a number on a spreadsheet.
Salespeople always want to go work for the winning company. Everyone in a competitive industry knows who the dominant player is. Customers know too. And the revenue line is where all of that shows up in a form that any investor can read.
One strong quarter of sales could be a fluke. A seasonal deal. A one-time contract that pulled in a lot at once. But three quarters of accelerating revenue, where growth is building on top of itself, that tells you something real is happening in that marketplace. Customers are choosing this company over and over. Demand is real and it’s intensifying. You don’t need to understand every technical detail of the product or the dynamics of the industry to read that signal. The sales numbers are giving you the answer directly.
That’s the cheat code I wish someone had handed me when I first opened a brokerage account.

When I started studying investing seriously, I read everything I could get my hands on. Technical analysis. Fundamental analysis. Books from traders who lived inside price charts and books from investors who lived inside balance sheets. I was looking for a system that made sense to me, something that felt like it had a real foundation under it.
Peter Lynch stopped me cold.
Lynch ran the Magellan Fund at Fidelity for thirteen years and turned it into the best-performing mutual fund in the world during that run. The guy had a track record that made every other professional investor look sideways at their own career. And when he sat down to write about how he actually thought about stocks, he kept coming back to one thing.
He had a chapter called “Earnings, Earnings, Earnings.” Just that word, three times. Like he wanted to make absolutely sure the reader understood what mattered most.
His argument was simple enough that it almost sounds obvious in hindsight. A company that grows its earnings year after year will eventually be worth more. A company whose earnings are shrinking will eventually be worth less. The stock price will follow the earnings over time, not the other way around. All the noise around a stock, the headlines and the analyst ratings and the macro commentary, fades into the background when you understand that the earnings are the engine and the price is just reflecting it.
When I read that, something clicked. Because Lynch was describing from a finance perspective the exact same thing I had spent years learning from a sales perspective. The front-line signal was the same. The logic was the same. He just had a different word for the revenue momentum I had watched play out in deal cycles throughout my career.
When two completely different disciplines, built by people who came up through completely different worlds, arrive at the same conclusion independently, that conclusion tends to be true.
Lynch confirmed what the front lines had already taught me.
So here is what I actually look for, kept as simple as I can make it:
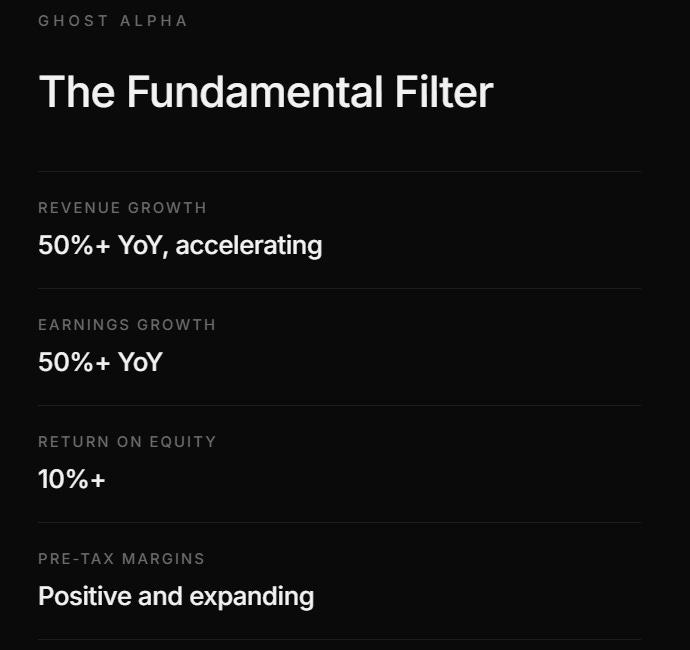
Revenue growth is the first thing I screen for, and I want to see it above fifty percent and accelerating. Quarterly, year over year. I want that growth rate moving higher. Forty percent one quarter, sixty the next, eighty after that. Each quarter confirming that the demand for this company’s product is building, that customers are choosing it at a faster and faster rate.
Revenue growth is the front-line signal. It tells you the market is voting for this company in real time.
Earnings growth is the second thing. I want to see that above fifty percent as well. Revenue tells you the company is winning customers. Earnings tell you the company is converting those customers into actual profit. Both matter, and I want both moving in the same direction at the same speed.
Those two filters alone, applied consistently, will take a universe of thousands of publicly traded companies and narrow it down to a handful. From there, the price chart tells you when to get in and where to put your stop. The fundamentals give you the conviction to hold through volatility. The chart gives you the timing and the risk management.
You do not need to be an expert in every industry. You do not need to understand the technical details of a semiconductor product or the regulatory environment of a healthcare company. The revenue growth number will tell you whether customers are choosing this company over the competition. The earnings growth number will tell you whether the business is financially healthy enough to sustain it. That combination, identified early, is how regular investors find the stocks that change their portfolios.
This is not a complicated system. And it works.
Most people who feel intimidated by investing are really just intimidated by the language around it. The jargon. The acronyms. The sense that there is some insider knowledge they are missing that everyone else on Wall Street already has.
There isn’t. The people who make money in markets over time are mostly doing a version of the same thing. They are finding businesses where demand is real and accelerating, where the sales line is growing faster than expected, where the earnings are confirming the story. And then they are patient enough to hold while the rest of the market catches up.
You have already seen this pattern play out in the real world, whether you realized it or not. You have watched a company go from a product people were talking about to a product everyone was buying to a stock that had already tripled before most people thought to look at it. The signal was in the revenue growth the whole time.
The only skill you are actually building when you learn to read earnings and sales data is the skill of listening to what the market is already telling you.
The front lines always know first. Now you do too.
Ghost Alpha is a weekly newsletter documenting one trader’s active investing journey, built on the CAN SLIM methodology and over a decade of real trades. If this was useful, subscribe below. There’s a lot more where this came from.
I liked that this didn’t feel overly complicated even for someone outside the investing world.